How to conduct a risk assessment using the fishbone diagram
A risk assessment is the first step toward creating a safe workplace. There are several methods to conduct a risk inventory and evaluation (RI&E), or risk assessment for short. In this article, we examine the fishbone or Ishikawa diagram. It is named after its schematic representation, which resembles a fishbone.

WHAT IS A FISHBONE DIAGRAM?
The fishbone diagram is a tool used as part of a collaborative strategy to identify workplace risks. This allows you to take appropriate actions to ensure health and safety in the workplace.
A risk assessment with the fishbone diagram – also called the Ishikawa diagram – is akin to the what-if method. Specifically, it is used to carefully analyze all identified risks during a brainstorming session. Instead of just listing the possible risks and outlining general safety measures, you start by 'filleting' them one by one.
A FISHBONE DIAGRAM IN THREE STEPS
According to the Ishikawa risk analysis, a fishbone diagram includes each risk along with the factors that affect it and how they do so.
Step 1
Identification. What is the specific risk?
Step 2
Identify the factors. What factors are involved? In an industrial environment, the most important factors are environment, vehicles, people, and processes.
Step 3
Influence. How can you influence each factor to mitigate the risk?
After conducting a risk analysis, the next logical step is to create a traffic plan, i.e., mapping the traffic flows in your workplace and identifying the bottlenecks.
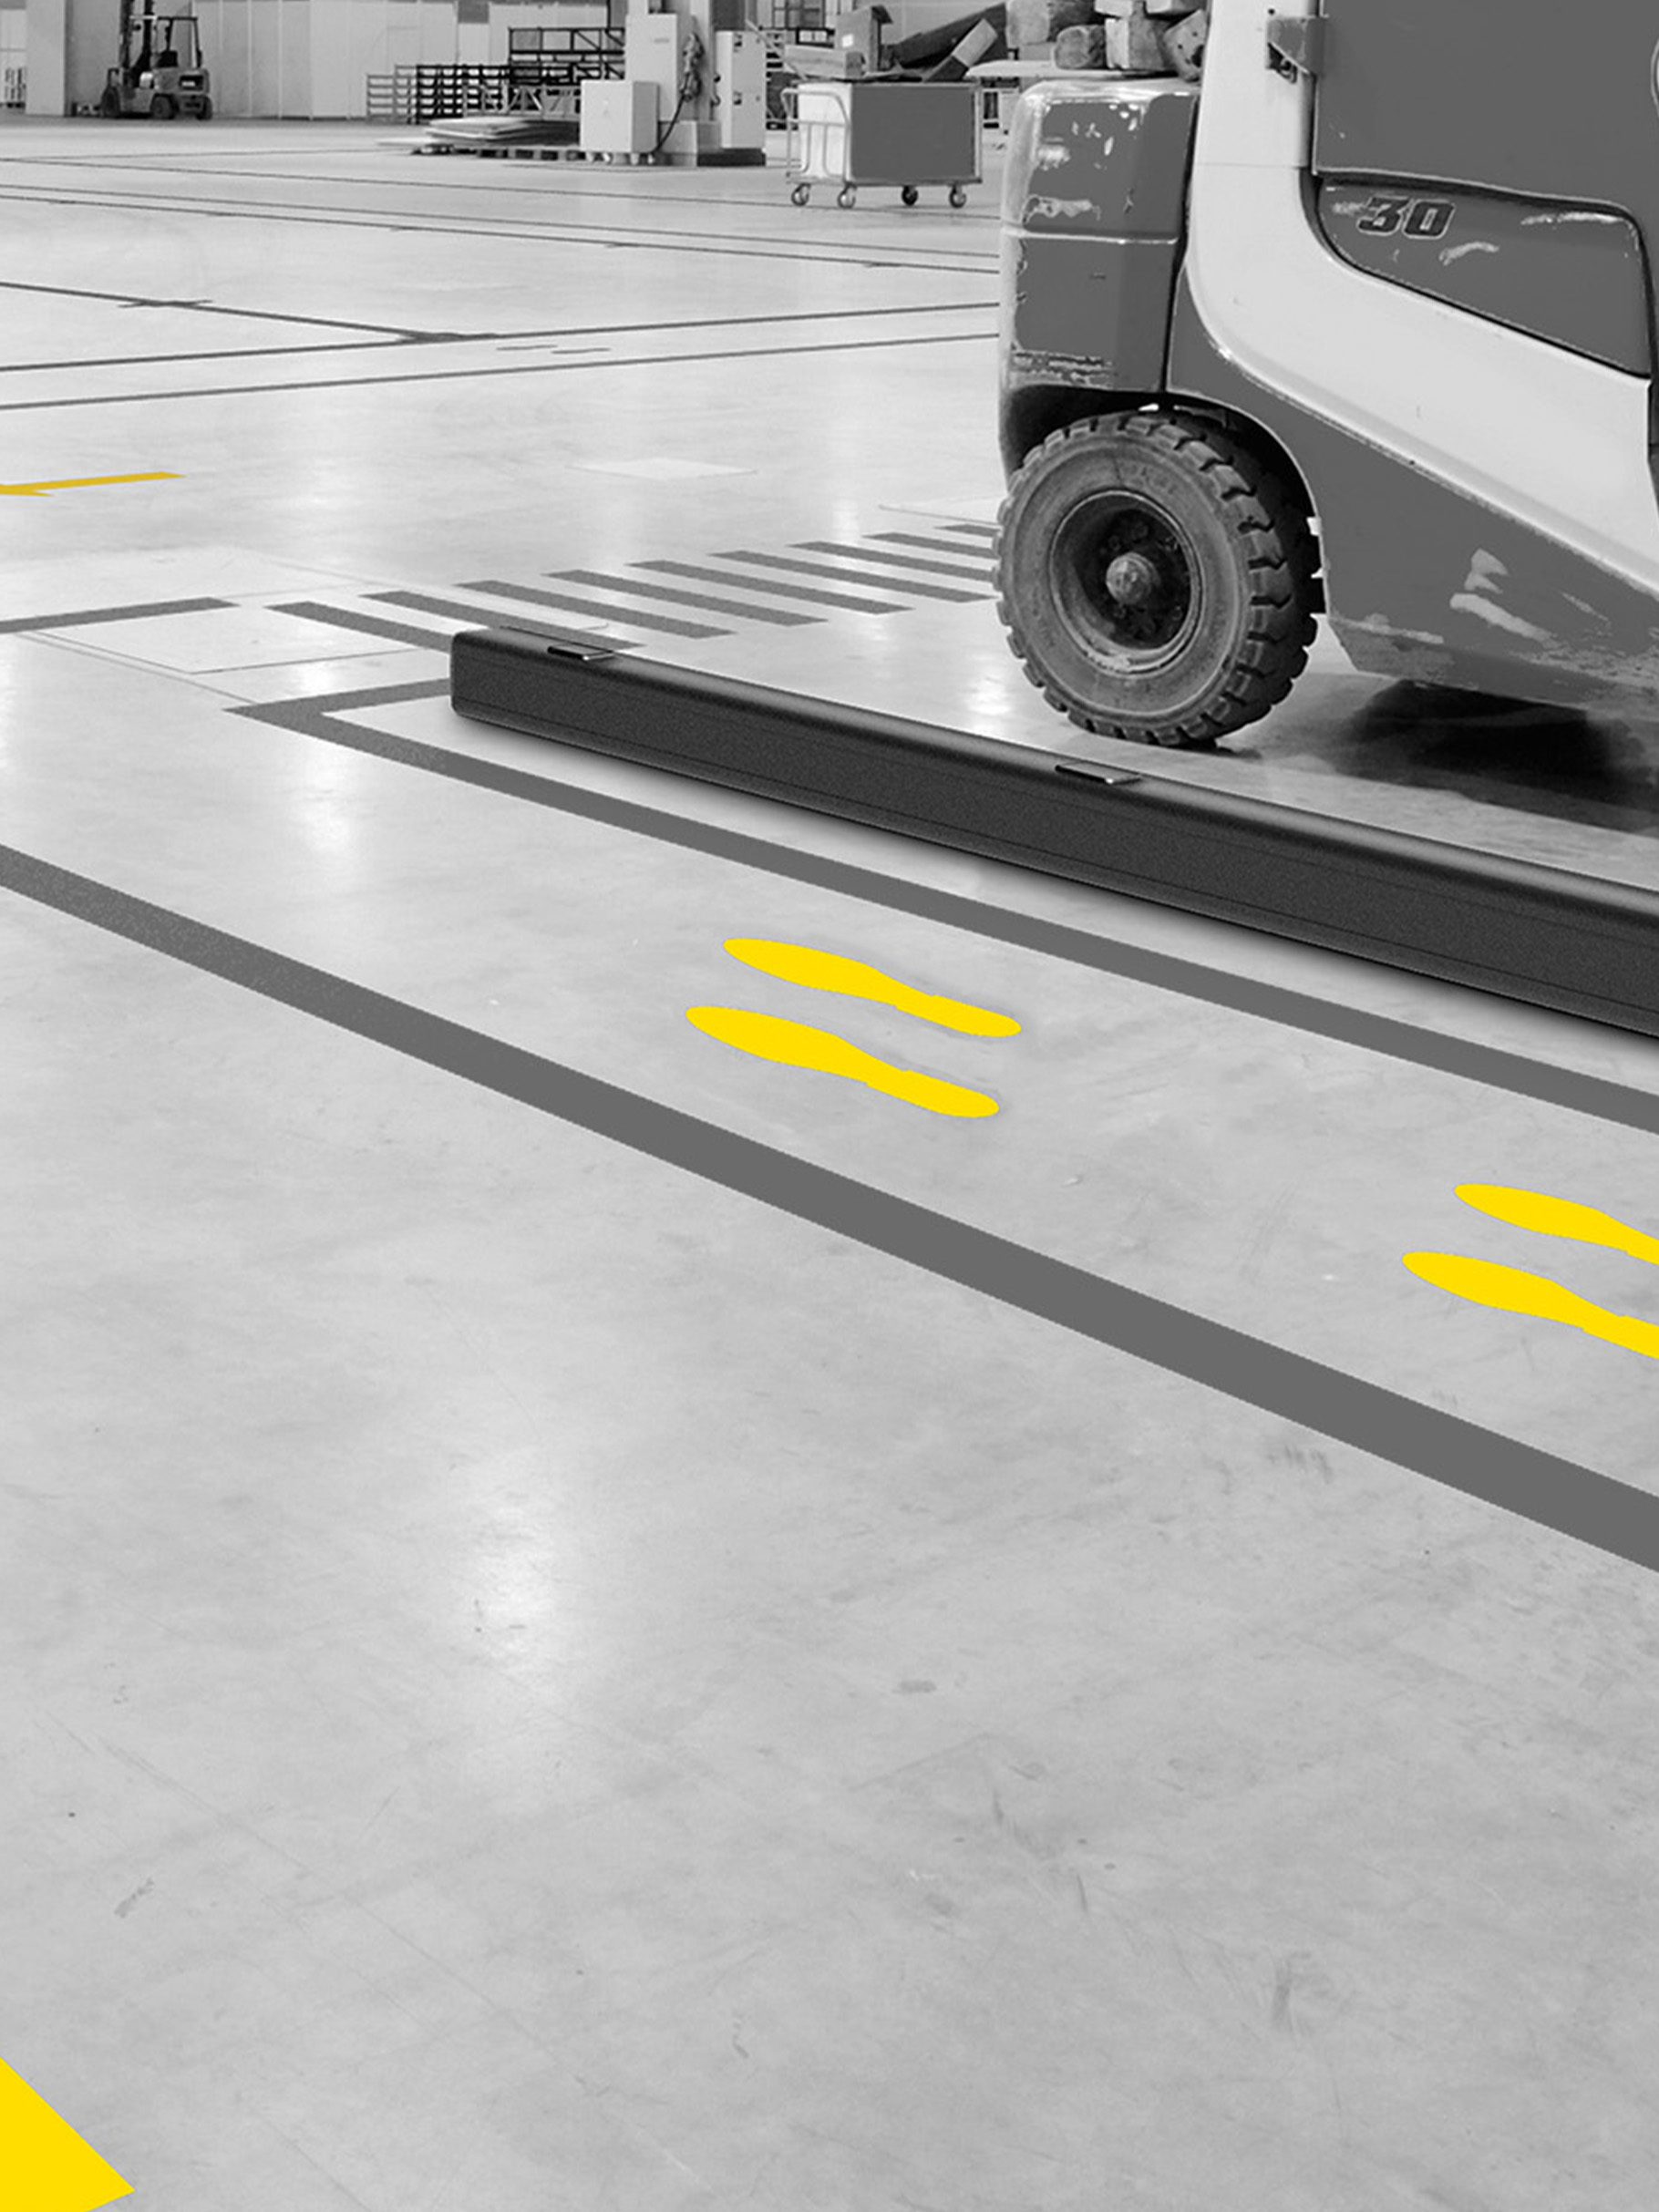
The vehicle factor
Poorly maintained vehicles reduce warehouse safety. Key vehicle functions such as brakes, lift trucks and warning devices are not regularly checked. Forklifts are aging and experiencing the ravages of time due to heavy use. In addition, their technology no longer meets today's safety regulations.
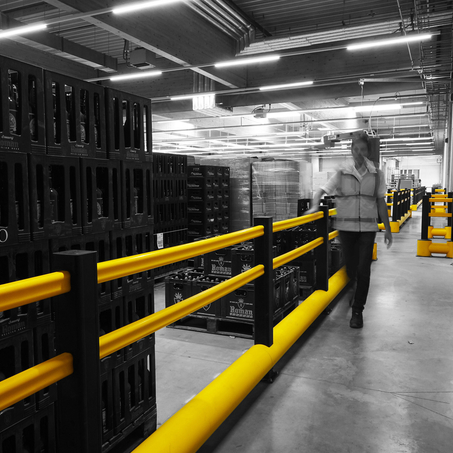
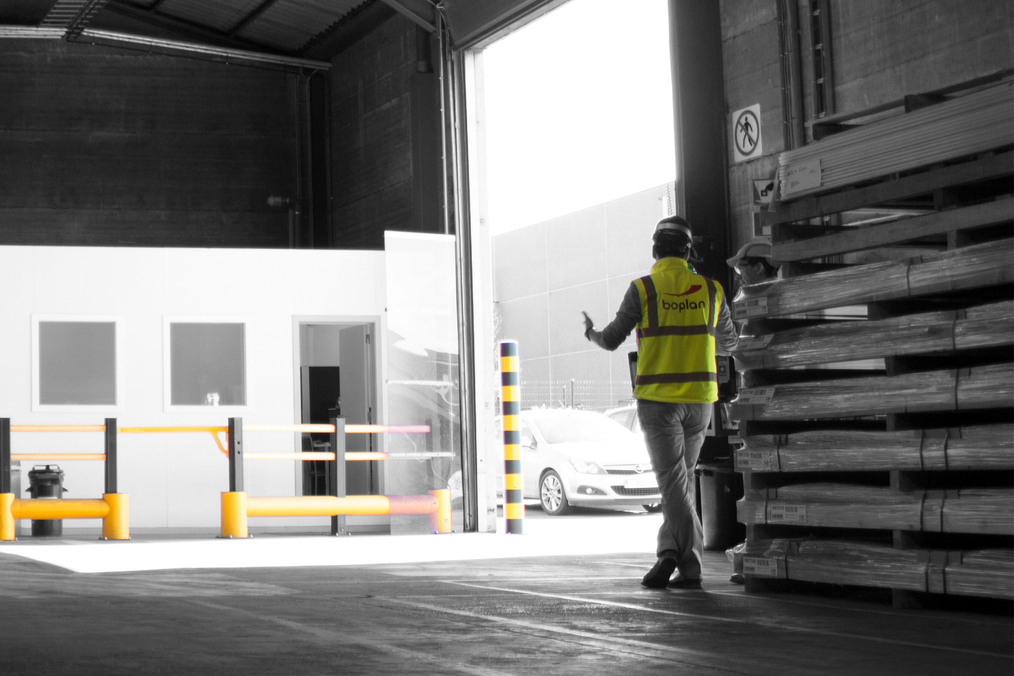
The people factor
The operator is untrained or poorly trained. The forklift driver makes a judgment or steering error due to time pressure, inefficiency, or personal distraction. In addition, pedestrians are unaware or uninformed about hazard zones and lanes.
The procedures factor
Improper loading methods are used. The method of ballast loading is not appropriate for the type of vehicle or its equipment. Excessive workload also plays a role. Under time pressure, workers load more than is allowed within safety limits.
What are the benefits of using a fishbone diagram?
The primary benefit of using a fishbone diagram for risk assessment is that it helps you quickly identify all the causes and devise possible solutions.
What are the drawbacks of using a fishbone diagram?
Highly complex problems with multiple causes and relationships may be too difficult to analyze using a fishbone diagram.